Facebook has purportedly spent at least $500 million to bring a wide range of content to its VR headsets. A portion of that investment was bet on big budget exclusive games, like Asgard’s Wrath and Medal of Honor: Above and Beyond, which aimed to satisfy a craving for AA and AAA VR content among gamers. But how much impact did it have?
While Facebook has funded a wide range of VR content, from 360 videos to non-exclusive indie VR games, the company has stated that a portion of the money it has spent on VR content was with the explicit goal of delivering larger AA and AAA titles to its platform that would attract gamers accustomed to seeing large scope, high production value content in the non-VR gaming world. These large titles represented many of the largest single bets the company placed on VR content, and indeed, many of the best-funded projects in all of VR, with some titles believed to have budgets in the tens of millions of dollars.
Defining Scope
Right up front it should be said that there’s a number of different ways one could consider Facebook’s Oculus exclusive content ‘successful’ or not. And, since we don’t know the budgets of each game, there’s not a clear definition for what even counts as the ‘big bets’ the company has made on content.
I’ll be clearly defining the assumptions made in order to answer these questions, starting with which games we’ll focus on.
First, we’re going to be looking specifically at the Oculus PC store since the bulk of Oculus exclusive content was made for that marketplace, giving us more data to analyze.
To look at the ‘big bets’, let’s start by listing all of the games the ‘Oculus Originals‘ section (and pulling in known ‘Oculus Studios’ titles that are oddly omitted). From there let’s only look at titles with a launch price higher than $30, as we can use the launch price as a proxy for how much value the project was expected to be worth (and therefore a coarse indication of the budget). There’s one exception to this rule which is the Vader Immortal games. I chose to keep all three in the list because they were released rapidly (all in the same year) and were effectively meant to form one complete $30 experience (in fact, on PSVR they are all sold as a single game with a $30 price tag).
This leaves us with the following list of 25 ‘big bets’ Facebook placed on VR games.
| Game | Release | Developer |
| Chronos | 2016 | Gunfire |
| Feral Rites | 2016 | Insomniac |
| Edge of Nowhere | 2016 | Insomniac |
| Eve Valkyrie | 2016 | CCP |
| The Climb | 2016 | Crytek |
| Robo Recall | 2017 | Epic |
| Rock Band VR | 2017 | Harmonix |
| Wilson’s Heart | 2017 | Twisted Pixel |
| The Mage’s Tale | 2017 | inXile |
| Lone Echo | 2017 | Ready at Dawn |
| Arktika.1 | 2017 | 4A Games |
| From Other Suns | 2017 | Gunfire |
| Brass Tactics | 2018 | Hidden Path |
| Marvel Powers United VR | 2018 | Sanzaru |
| Dance Central | 2019 | Harmonix |
| Journey of the Gods | 2019 | Turtle Rock |
| Vader Immortal I | 2019 | ILMxLAB |
| Vader Immortal II | 2019 | ILMxLAB |
| Vader Immortal III | 2019 | ILMxLAB |
| Stormland | 2019 | Insomniac |
| Asgard’s Wrath | 2019 | Sanzaru |
| Sports Scramble | 2019 | Armature |
| Lies Beneath | 2020 | Drifter |
| Phantom: Covert Ops | 2020 | nDreams |
| Medal of Honor: Above and Beyond | 2020 | Respawn |
Defining Value
Now the question is, ‘how do we determine if the bets Facebook placed on these games were successful’?
From Facebook’s standpoint, these large exclusive content investments were made to jumpstart its VR content library, and to show gamers that polished, large scope VR games were available and ready to be played.
Thus, looking at ‘value provided to customers’ seems like a good approach to consider the ‘success’ of that proposition. Luckily, each customer has the opportunity to voice their opinion of a game’s value by giving the game a rating based on their experience with it compared to what they paid. Here’s how these 25 games stack up by user ratings:
| Game | Release | Developer | User Reviews |
| Lone Echo | 2017 | Ready at Dawn | 4.70 |
| Brass Tactics | 2018 | Hidden Path | 4.69 |
| Robo Recall | 2017 | Epic | 4.68 |
| Dance Central | 2019 | Harmonix | 4.64 |
| Vader Immortal I | 2019 | ILMxLAB | 4.55 |
| Asgard’s Wrath | 2019 | Sanzaru | 4.49 |
| Stormland | 2019 | Insomniac | 4.48 |
| Journey of the Gods | 2019 | Turtle Rock | 4.47 |
| Edge of Nowhere | 2016 | Insomniac | 4.44 |
| Vader Immortal III | 2019 | ILMxLAB | 4.40 |
| Chronos | 2016 | Gunfire | 4.39 |
| Lies Beneath | 2020 | Drifter | 4.35 |
| Phantom: Covert Ops | 2020 | nDreams | 4.34 |
| Wilson’s Heart | 2017 | Twisted Pixel | 4.32 |
| From Other Suns | 2017 | Gunfire | 4.31 |
| The Climb | 2016 | Crytek | 4.27 |
| Vader Immortal II | 2019 | ILMxLAB | 4.26 |
| Sports Scramble | 2019 | Armature | 4.26 |
| The Mage’s Tale | 2017 | inXile | 4.21 |
| Rock Band VR | 2017 | Harmonix | 4.03 |
| Arktika.1 | 2017 | 4A Games | 4.01 |
| Marvel Powers United VR | 2018 | Sanzaru | 3.88 |
| Feral Rites | 2016 | Insomniac | 3.83 |
| Eve Valkyrie | 2016 | CCP | 3.82 |
| Medal of Honor: Above and Beyond | 2020 | Respawn | 3.81 |
Comparing Value
So now we have a way to gauge how players valued these exclusive games. But how do we determine if it was ‘worth it’ for Facebook to have made these bets in the first place?
Clearly the goal of bringing these titles to market was to raise the value of the company’s VR content offering. By comparing the rating of each exclusive to the average rating of all games released that year* we can get an idea of ‘how much’ each game added to or detracted from that year’s baseline content quality.
| Game | Release | Rating | Rating vs. Release Year Average Rating |
| Edge of Nowhere | 2016 | 4.44 | +0.78 |
| Chronos | 2016 | 4.39 | +0.73 |
| The Climb | 2016 | 4.27 | +0.61 |
| Feral Rites | 2016 | 3.83 | +0.17 |
| Eve Valkyrie | 2016 | 3.82 | +0.16 |
| Lone Echo | 2017 | 4.70 | +0.80 |
| Robo Recall | 2017 | 4.68 | +0.78 |
| Wilson’s Heart | 2017 | 4.32 | +0.42 |
| From Other Suns | 2017 | 4.31 | +0.41 |
| The Mage’s Tale | 2017 | 4.21 | +0.31 |
| Rock Band VR | 2017 | 4.03 | +0.13 |
| Arktika.1 | 2017 | 4.01 | +0.11 |
| Brass Tactics | 2018 | 4.69 | +0.62 |
| Marvel Powers United VR | 2018 | 3.88 | −0.18 |
| Dance Central | 2019 | 4.64 | +0.43 |
| Vader Immortal I | 2019 | 4.55 | +0.34 |
| Asgard’s Wrath | 2019 | 4.49 | +0.29 |
| Stormland | 2019 | 4.48 | +0.27 |
| Journey of the Gods | 2019 | 4.47 | +0.27 |
| Vader Immortal III | 2019 | 4.40 | +0.20 |
| Vader Immortal II | 2019 | 4.26 | +0.06 |
| Sports Scramble | 2019 | 4.26 | +0.05 |
| Lies Beneath | 2020 | 4.35 | +0.28 |
| Phantom: Covert Ops | 2020 | 4.34 | +0.27 |
| Medal of Honor: Above and Beyond | 2020 | 3.81 | −0.26 |
* games with less than 100 reviews are excluded from the release year average to remove outliers
So we can see that Oculus exclusives have a good track record at least of exceeding the average game rating in their given release year.
Outliers: The low ratings of Marvel Powers United VR and Medal of Honor: Above and Beyond, are particularly interesting. It’s easy to imagine that big budget games automatically get a boost to user ratings thanks to more resources for polish and presentation. But those two games are thought to be two of the three largest investments Facebook has made in Oculus exclusive content. What happened?
To an extent, this means most of the exclusive content investments the company made have positively benefited the overall position of the content library. But ‘how much’ matters here too; this is the year-by-year breakdown:
| Year |
Average Rating Difference Among Oculus Exclusives
|
| 2016 | +9.80% |
| 2017 | +8.44% |
| 2018 | +4.42% |
| 2019 | +4.78% |
| 2020 | +1.96% |
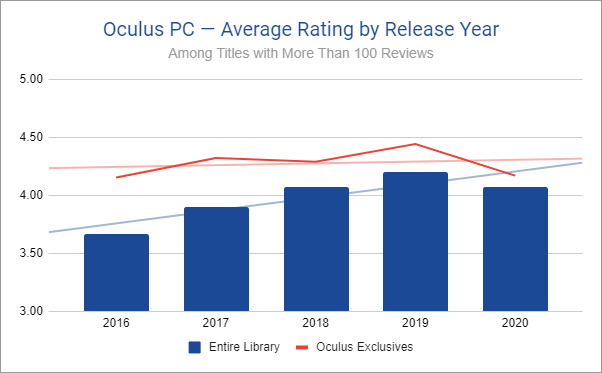
It’s clear to see here that Facebook’s efforts never managed to produce content which exceeded the release year’s average by more than 10%, and the benefit of Oculus exclusives, against games released in the same year, dropped off steadily as time went on.
There’s two likely explanations for this. Either Facebook’s bets were getting worse over time, or non-exclusive content was getting better over time. While it could be a combination of the two, it appears that the latter is the most significant factor, which we can see when comparing the average rating of games in the library each year to the average rating of Oculus exclusive games in the same year.


