Table of Contents
- Introduction
- GTX 1080 Ti Specs
- Testing Methodology & FCAT VR Primer
- Overclocking
- Benchmarks
- Standard Gaming Performance
- Rise of the Tomb Raider (DX11 and DX 12)
- Deus Ex: Mankind Dividied
- The Division
- VR Gaming Performance
- Dirt Rally VR
- Showdown
- Standard Gaming Performance
- Conclusion
VR Gaming Performance
With FCAT VR we finally have a tool which allows us to peek under the hood of today’s complex PC VR render pipeline. With VR’s lofty technical demands, both main PC VR hardware vendors offer up mitigation strategies for helping hardware and software to achieve the 90FPS requirement for comfortable experiences in both the Oculus Rift and HTC Vive headsets. These strategies (Asynchronous Timewarp / Spacewarp / Reprojection) involve the insertion of synthetic frames when rendering can’t hold a consistent 90 FPS.
FCAT VR exposes not only frametime latency (how long the PC took to render an image) but also dropped frames (where Asynchronous Time Warp kicked in) and importantly how many synthetic/re-projected frames using Oculus’ Asynchronous Space Warp were recorded on a benchmark run, and it displays them in nice, pretty graphs. We’ll have performance stats on SteamVR and HTC Vive hardware soon too, but for this article we benchmarked using the consumer Oculus Rift headset and version 1.12.x software and runtime.
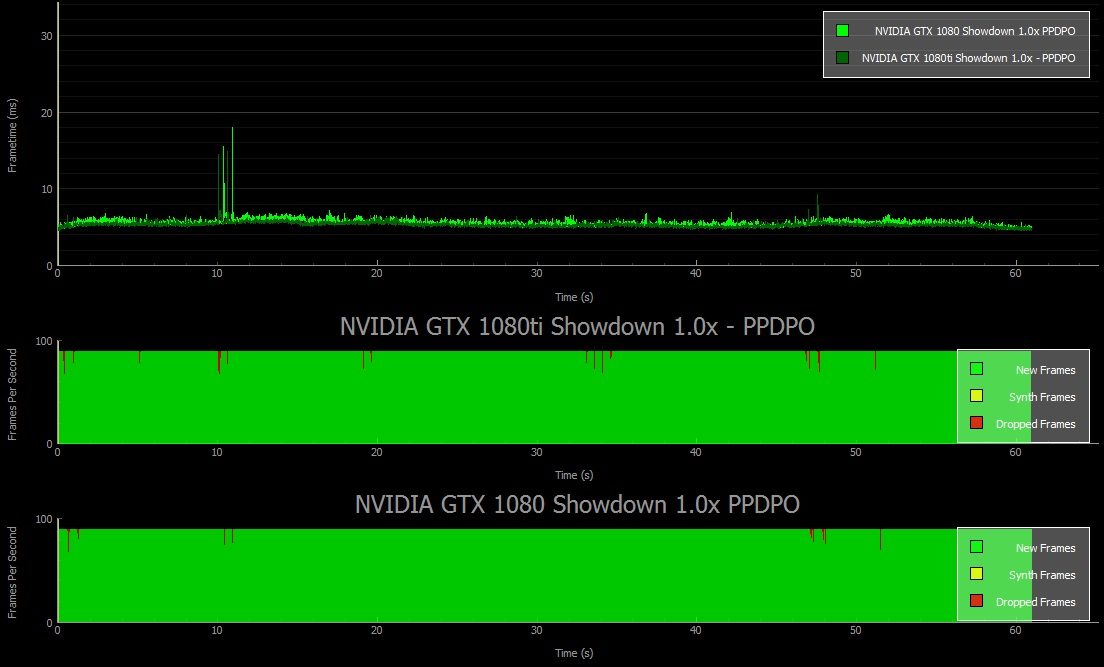
In the metric images below, you’ll see each split into two, the top section detailing frametime latency (remember, we need sub 11ms results per frame to hit a solid ‘genuine’ 90FPS) and a breakdown of how frames were eventually delivered to the headset in the bottom section. You’ll see dropped frames (marked in red and where Asynchronous Time Warp will kick in automatically to stabilise the experience) and where synthetic frames had to be generated due to latency rising too high (marked in yellow – indicating where Oculus’ Asynchronous Space Warp kicked in). ASW is the absolute last resort in these scenarios and should be avoided if possible. But bear in mind that some synthetic frame generation may be undetectable so it is not the end of the world for the VR experience. Read more on the topic in our group GPU test with FCAT VR right here.
Dirt Rally VR
 One of the most impressive VR gaming experiences to date, Dirt Rally also happens to be one of the best driving games in quite some time. Codemasters’ implementation of VR here is excellent and as an argument for how virtual reality can enhance and transform a standard gaming experience, Dirt Rally works brilliantly.
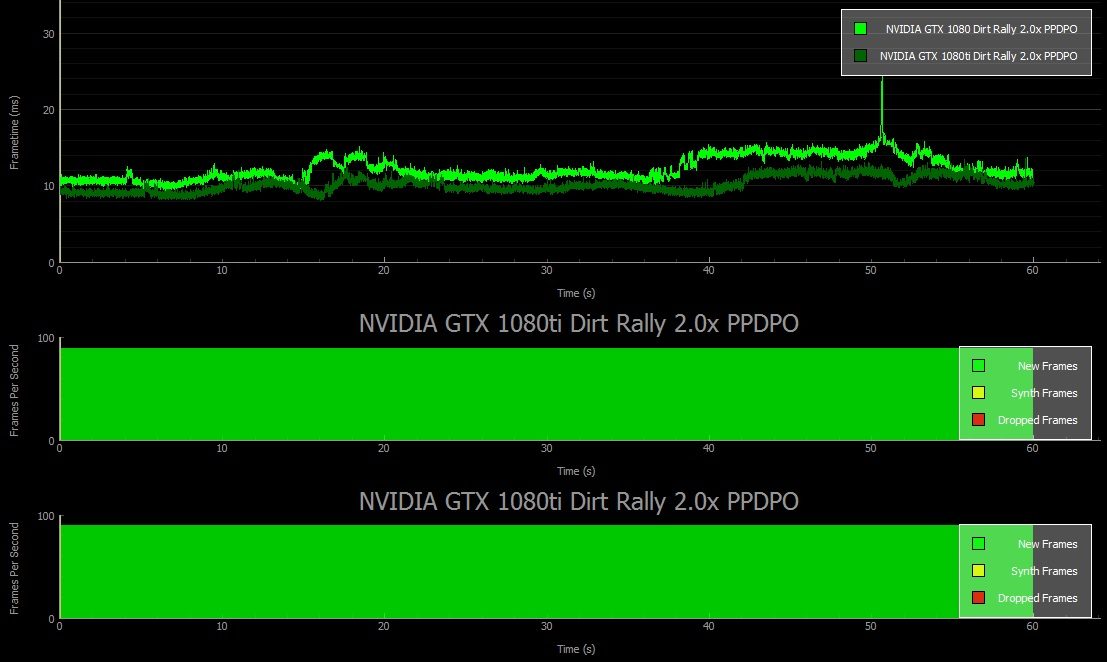
Unfortunately, Dirt Rally’s in-game benchmark doesn’t engage fully when in VR mode, which meant coming up with a repeatable test drive for each run. In this case we drove for 60 seconds per test, increasing Supersampling each time – between 1.0x, 2.0x, 2.5x and 3.0x via Oculus’ debug tool. For each run we took as similar a route and speed as possible, keeping our head position mostly fixed throughout. Below are the combined graphs for each run with the raw results numbers below – click to enlarge.
1.0x PPDPO (No Supersampling)
Some anomalies here – you can see each card more than capably stayed below the 11ms threshold, and despite this we see occasional dropped frames – but they clearly have no impact on the VR experience. We’ll be speaking to NVIDIA about these to try and explain them.
2.0x PPDPO (2x Supersampling)
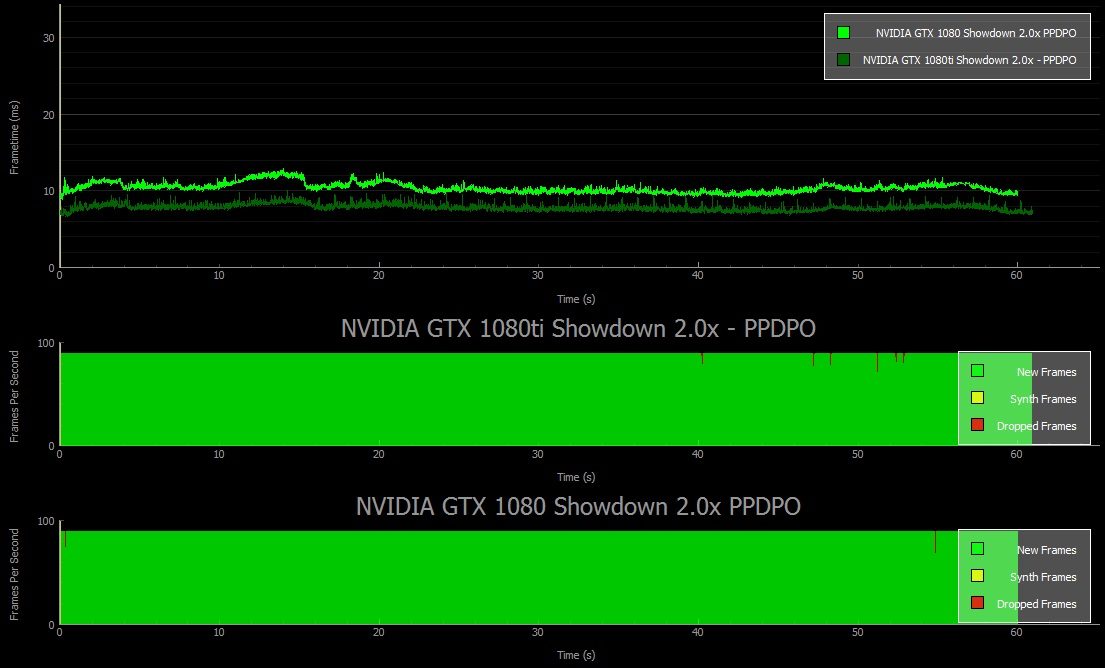
At 2x SS, both cards still turn in a solid performance, but you can see the divergence in frametime beginning to show. There’s a performance blip towards the end of the experience here, but clearly the digression wasn’t great enough for the runtime to enforce ASW – and the average delivered FPS seems to back that up.
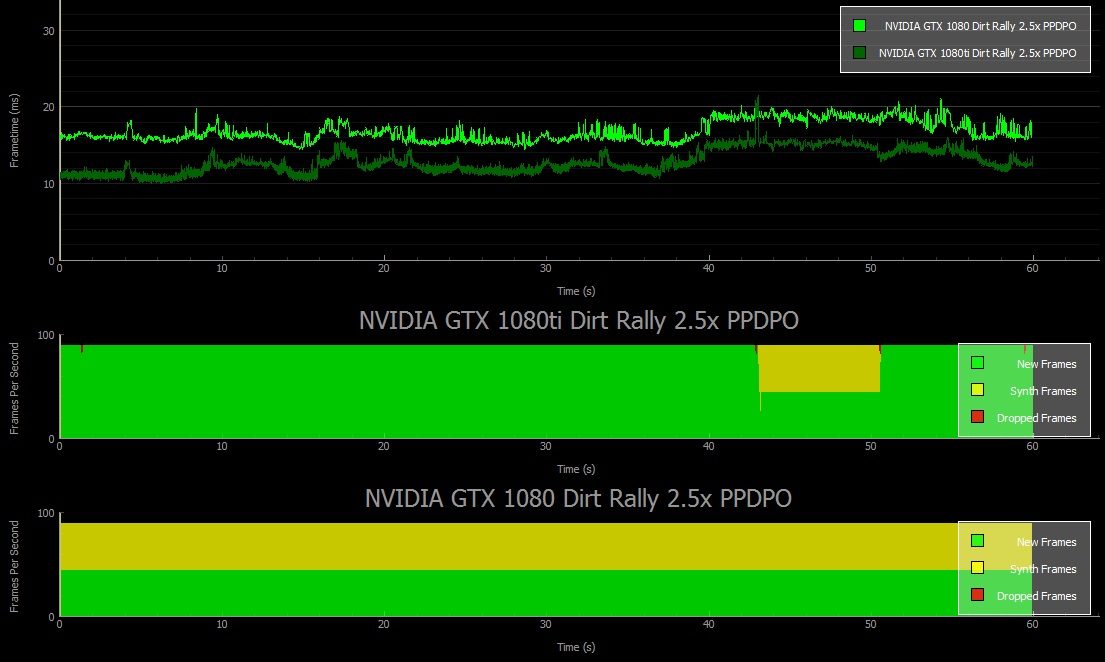
2.5x PPDPO (2x Supersampling)
At 2.5X we’re pushing some serious pixels and the 1080 now solidly exceeds 11ms in frametime, so much so that ASW has had to step in from the off to stabilise performance. experientially, the qualitative difference in image is negligible when compared to 2x SS.
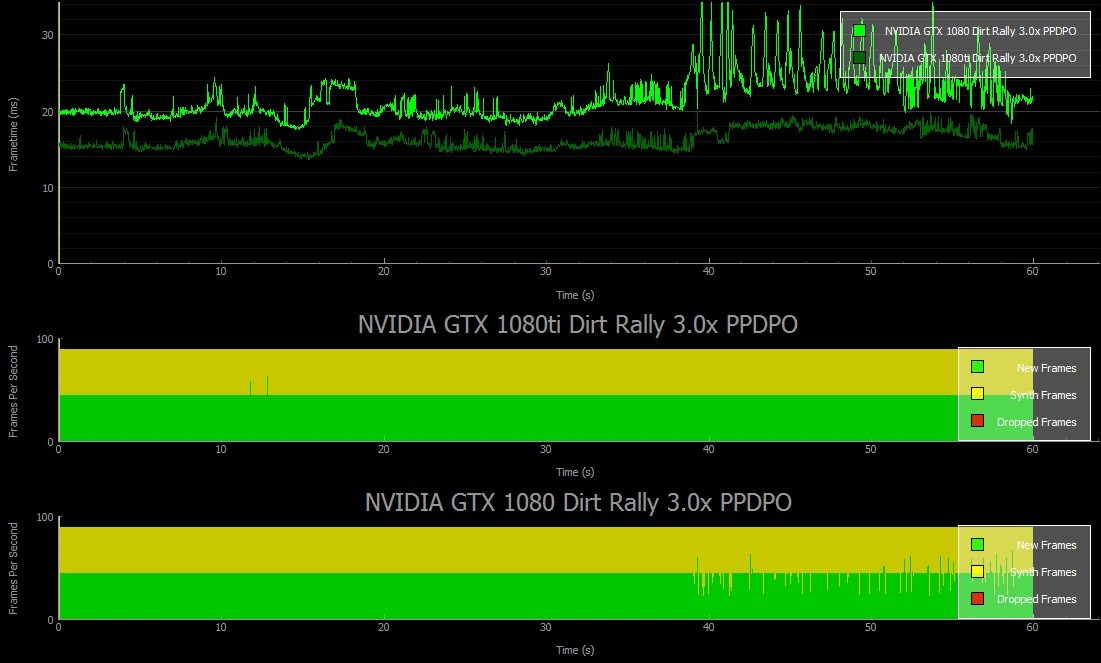
3.0x PPDPO (3x Supersampling)
Now at 3x SS we’re in the realms of snake oil in terms of visual fidelity improvement, but as an experiment it’s useful to see that by this point the 1080 simply can’t deliver a stomach-able performance level even with ASW locked in place. The experience when playing with the 1080Ti however was manageable if clearly not ideal, it remained playable here even if I wouldn’t recommend it.
Showdown
Epic Games’ Unreal Engine powered Showdown is a brilliantly simple concept, throw the VR user in slow motion through a futuristic urban battleground, witnessing the chaos as a rampaging robot lets loose on a street full of armed police. It’s a little long in the tooth at this point, but it was the star attraction at Oculus Connect 2015 where it was used as the centrepiece demo for Oculus’ final publicly shown Oculus Rift prototype, the Crescent Bay.
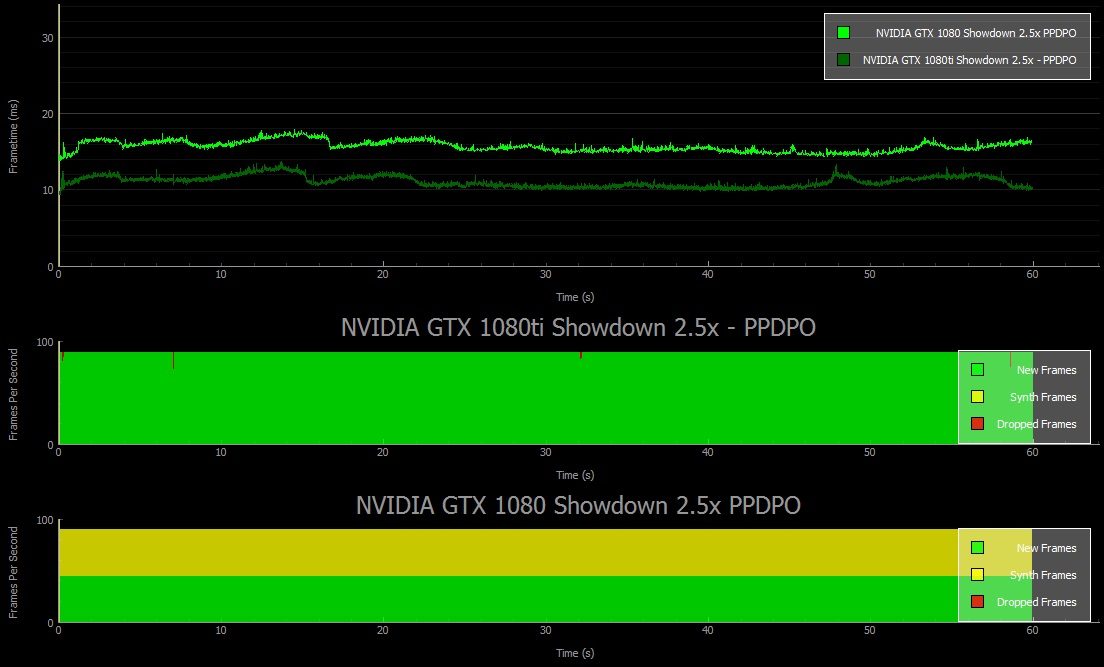
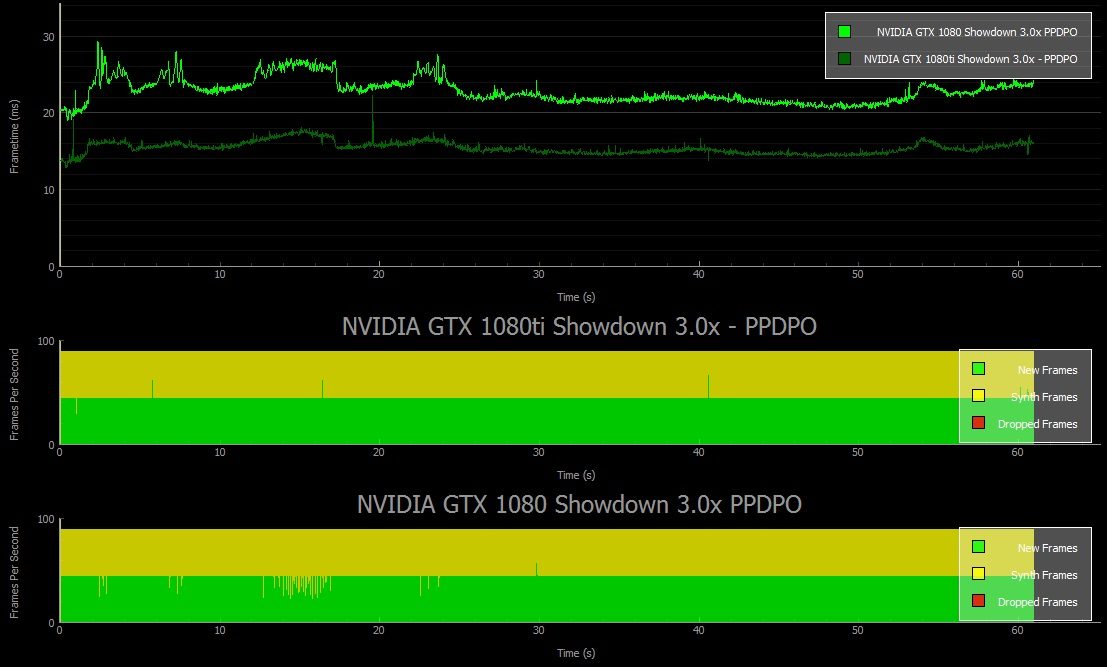
As the experience is on rails we ran through the experience for 60 seconds a time, for each run we increased the supersampling (aka Pixels Per Display Pixel Override) level between 1.0x, 2.0x, 2.5x and 3.0x via Oculus’ debug tool. As you can see, these cards are having to push some serious pixels at 90FPS in order to achieve this.
Below are the combined graphs for each run with the raw results numbers right underneath – they’re a little tiny, so click to enlarge.
1.0x PPDPO (No Supersampling)
 2.5x PPDPO (2.5x Supersampling)
Here at 2.5x SS, the 1080Ti takes it all in its stride and delivers a stable 90FPS throughout the experience. The 1080 however has buckled a little at this point with ASW engaged from the off.
3.0x PPDPO (3.0x Supersampling)
At the ludicrous 3x SS setting, the 1080 again cannot take the heat, leaving the Ti to deliver an acceptable if far from ideal experience inside the headset with ASW engaged.
Conclusion
The GTX 1080 Ti provides a compelling price to performance prospect. Whilst Nvidia are still asking you to part with $700 for the privilege of thumbing your nose at Titan X owners, what you get as a standard gamer and as a VR enthusiast is the power to literally max the image quality capabilities of your chosen VR headset and a damn sight more.
Existing owners of a GTX 980ti face the proposition of gaining up to and beyond a 100% uplift in standard gaming performance should they upgrade to the 1080ti. But the 1080ti also offers up tantalising and tangible experiential benefits for virtual reality enthusiasts. Yes our tests here are intentionally over the top, at anything over 1.8x supersampling levels, your experience will be limited by the VR headset panels and not the rendered image. But, the ability to push VR titles at these resolutions, achieving in many cases a fully-rendered (i.e. with no need for reprojection and ASW) 90FPS mean your investment will very likely see you through to the next generation of VR headsets and beyond.
One thing we’ve not had time to cover here are the potential benefits gleaned from vendor specific VR architecture features introduced with the 10-series Pascal chipset. Features like Lens Matched Shading are still not found in many titles yet, with developers having to code specifically for those features in order for the application to benefit. We’ll revisit this topic again in the future with any luck.
The cynics out there will argue that the GTX 1080 Ti is an aggressive pre-emptive strike against the forthcoming AMD ‘Vega’ GPU architecture, which is rumoured to even the fight between red and green. The first AMD ‘Vega’ card may arrive as early as May this year, meaning it may be prudent to hang on for a few weeks until we see verified figures for those. That’s not too long to wait.
Disclosure: NVIDIA provided Road to VR with a GTX 1080 Ti GPU for testing purposes.

