Chris Pruett, Oculus’ head of developer relations and co-founder of Robot Invader, elucidates more about the technical knacks for optimizing Unity-based works intended for the Samsung Gear VR mobile platform.
See Also: Oculus Shares Optimization Tips for Unity-based Gear VR Projects
In the second part of Pruett’s quick start guide to optimizing projects for Gear VR, the focus this time falls on the dreaded art of debugging. He warns that applications showing lower than the expected 60 FPS framerate required for an optimal experience will invariably need a closer look under the hood. And making sure everything get’s through the render pipeline in under 16 ms will require a few tools, specifically Unity’s internal profiler log, Unity’s Profiler, and the Oculus Remote Monitor.
“One way to think of the render pipeline is to imagine a train station. Trains leave at reliable times—every 16.6 ms. Let’s say the train only holds one person at a time, and there is a queue of folks waiting to catch a ride. As long as each person in the queue can make it to the platform and get on the next train before it leaves, you’ll be able to ship somebody out to their destination every 16 ms. But if even one guy moves too slowly—maybe he trips on his shoelaces—he’ll not only miss his train, he’ll be sitting there waiting on the platform for another 16 ms for the next train to come. Even though he might have only been 1 ms late for his train, missing it means that he has to sit there and wait a long time.”
The internal profiler gives you a readout of two important things: median framerate and drawcall count. If the diagnosis is grim, the next step is to go a bit deeper with the help of Unity’s profiler.

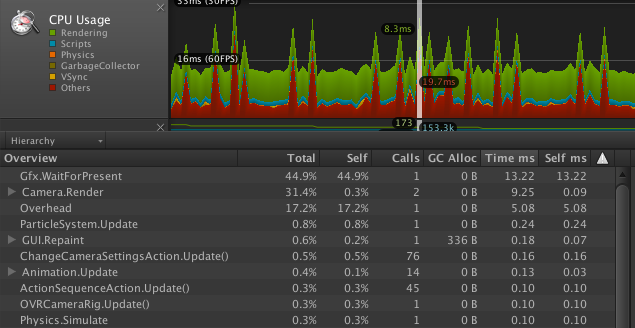
Above is an example of an application put through Unity’s profiler that has caught a perceived error, something called Gfx.WaitForPresent, a performance issue that Pruett maintains should be ignored “in the profiler and [rather] concentrate on optimizing everything else.”
See Also: Optimizing Games for VR Is About Finding Creative Solutions – Darknet Developer Shares His Insights
If this is the case, the only thing to do is optimize, optimize, optimize. Reducing drawcalls (keeping it under 100 per frame) and polygon count will significantly lighten the load on the smartphone’s CPU.
Another tool to help diagnose and visualize the render pipeline is OVRMonitor, a new tool recently released with the Oculus Mobile SDK. “It helps developers understand the way pipelining works and identify pipeline stalls. It can also stream low resolution unwarped video from a Gear VR device wirelessly, which is useful for usability testing.”
Tips and Tricks
- Draw big, opaque meshes last
- Dynamically change your CPU / GPU throttling settings
- Update render targets infrequently
- Lower the target eye resolution
- Compress your textures
- Use texture atlases
For more information on optimizing applications for Gear VR, visit Chris Pruett’s post on the Oculus Creator’s Blog. Even more detailed info can be found in “Best Practices: Mobile” in Oculus’ Unity Integration guide.


